一、首先准备需要的库
1、pandas//是python的一个数据分析包
2、matplotlib//是一个 Python 的 2D绘图库,它以各种硬拷贝格式和跨平台的交互式环境生成出版质量级别的图形。
3、jieba//jieba(结巴)是一个强大的分词库,完美支持中文分词
4、wordcloud//基于Python的词云生成类库
5、numpy//NumPy系统是Python的一种开源的数值计算扩展。这种工具可用来存储和处理大型矩阵,比Python自身的嵌套列表(nested list structure)结构要高效的多(该结构也可以用来表示矩阵(matrix))
二、用scrapy创建一个项目
scrapy startproject zufangSpider

scrapy genspider zufang http://zu.sh.fang.com/cities.aspx
三、实现房天下的的数据爬取
#初始化url
def start_requests(self):
    yield scrapy.Reques(self.city_url,callback=self.get_city)
#调用get_city()方法
 def get_city(self,response):
    url=response.xpath('/html/body/div[3]/div[1]/a/@href').extract()
    #循环热门城市
    for i in url:
        product={
            'city':i
        }
        yield scrapy.Request(product['city'],callback=self.city_parse, dont_filter=True)
        #循环爬取每一页
        for j in range(2,10):
            next_url=product['city']+'house/i3%s'%j
            yield scrapy.Request(next_url,callback=self.city_parse,dont_filter=True)
#调用city_parse()方法获取每一页的数据
def city_parse(self, response):
    zufang = response.xpath('//div[@class="houseList"]')
    for fangzi in zufang:
        title=fangzi.xpath('//p[@class="title"]/a/text()').extract()
        area =fangzi.xpath('//p[@class="gray6 mt20"]/a[1]/span[1]/text()').extract()
        rent_style = fangzi.xpath('//p[@class="font16 mt20 bold"]/text()[1]').extract()
        house_type= fangzi.xpath('//p[@class="font16 mt20 bold"]/text()[2]').extract()
        house_area = fangzi.xpath('//p[@class="font16 mt20 bold"]/text()[3]').extract()
        if fangzi.xpath('//p[@class="font16 mt20 bold"]/text()[4]'):
            orientation = fangzi.xpath('//p[@class="font16 mt20 bold"]/text()[4]').extract()
        else:
            orientation=''
        price = fangzi.xpath('//p[@class="mt5 alingC"]/span/text()').extract()
        for i in range(len(title)):
            item = ZufangScrapyItem()
            item['title']=title[i]
            item['area']=area[i]
            item['rent_style']=rent_style[i].strip()
            item['house_type']=house_type[i]
            item['house_area']=house_area[i]
            item['orientation']=orientation[i].strip()
            item['price']=price[i]
            yield item
四、对数据进行可视化
1、首先运行 scrapy crawl zufang -o zufang.csv
把数据保存成csv文件
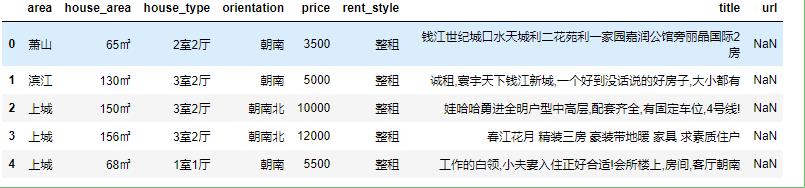
2、import pandas as pd
data=pd.read_csv(r'H:\Python\zufang_scrapy\zufang.csv')
data.head()
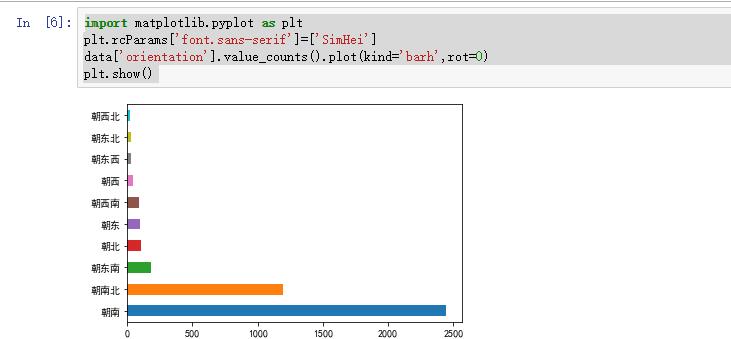
3、import matplotlib.pyplot as plt
plt.rcParams['font.sans-serif']=['SimHei']
data['orientation'].value_counts().plot(kind='barh',rot=0)
plt.show()
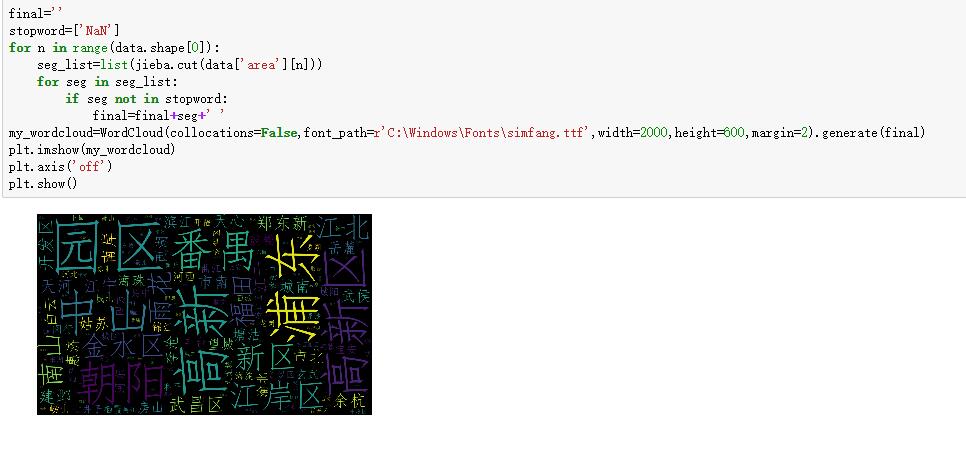
4、final=''
stopword=['NaN']
for n in range(data.shape[0]):
seg_list=list(jieba.cut(data['area'][n]))
for seg in seg_list:
    if seg not in stopword:
        final=final+seg+' '
my_wordcloud=WordCloud(collocations=False,font_path=r'C:\Windows\Fonts\simfang.ttf',width=2000,height=600,margin=2).generate(final)
plt.imshow(my_wordcloud)
plt.axis('off')
plt.show()
详细代码:可以访问我的 GitHub 地址